
AMAZON FBA PRODUCT RESEARCH
How to Read a Keepa Graph — Complete Guide for Amazon FBA Wholesale Sellers
By Brandhunterz Ltd | Company No: 15342697 | 13 minute read
Affiliate Disclosure: This article contains affiliate links. If you purchase through our links we may earn a commission at no extra cost to you. We only recommend tools we genuinely use and believe in. Read our full disclaimer.
If you sell on Amazon FBA or are planning to start reading a Keepa graph is one of the most valuable skills you will ever develop. Keepa tracks the complete price and sales rank history of every product on Amazon — going back up to two years — and displays that data as a visual chart that tells you exactly how a product has been selling whether prices are stable or declining and whether Amazon itself is active on the listing. Every sourcing decision you make as a wholesale FBA seller should be informed by a Keepa graph check. Without it you are guessing. With it you are making data-backed decisions.
We are Brandhunterz Ltd — a UK registered wholesale sourcing company (Company No: 15342697) — and in this complete guide we explain every line on a Keepa graph what each one tells you how to interpret the patterns that indicate a strong wholesale opportunity and the specific warning signs that should stop you from ordering a product before you spend a single pound on stock.
💡 Quick Summary
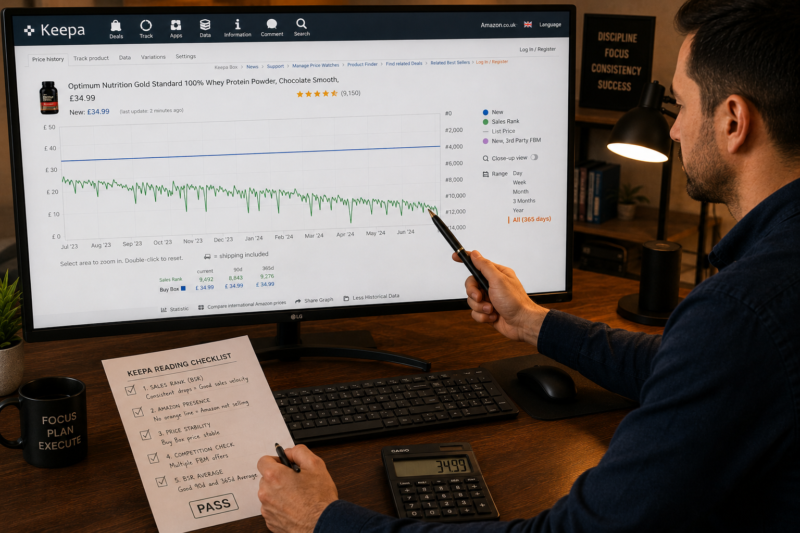
A Keepa graph has five key lines — the green line shows sales rank history the blue line shows the Buy Box price the orange line shows when Amazon is selling the red line shows the new third-party price and the yellow line shows the sales rank drops that indicate actual purchase events. For wholesale FBA sellers the three most important checks are consistent green line drops over 12 months no orange line presence and a stable or rising blue line. Start your free trial at keepa.com.
What is Keepa and Why Do Amazon FBA Sellers Need It?
Keepa is an Amazon price tracker that has been recording price and sales rank data for every product on Amazon since 2013. It stores this data and presents it as interactive charts available to subscribers — giving you historical context about any product’s performance that Amazon’s own platform never shows you.
Amazon only shows you what a product looks like right now — its current price current rank and current sellers. Keepa shows you what a product has looked like for the past 12 to 24 months — which is the difference between seeing a snapshot and seeing a film. For wholesale FBA sellers sourcing decisions must be based on the film not the snapshot. A product that looks great today might have had Amazon selling on it six months ago. A product with 3 sellers today might have had 15 sellers two months ago before prices crashed. Keepa shows you this history. Amazon does not.
| Without Keepa | With Keepa |
|---|---|
| You see today’s price only | You see 24 months of price history — rising falling or stable |
| You see today’s BSR only | You see 24 months of rank history — consistent or erratic |
| You cannot see if Amazon was ever selling | You see exactly when and how often Amazon entered the listing |
| You cannot see seller count history | You see how the number of sellers has changed over time |
| You make sourcing decisions on incomplete data | You make sourcing decisions on complete historical data |
The Five Lines on a Keepa Graph — What Each One Means
When you open a Keepa chart you will see multiple coloured lines plotted over a timeline. Each line tracks a different data point about the product. Here is exactly what each line represents and what you are looking for:
Line 1 — The Green Line — Amazon Best Seller Rank
The green line on the Keepa chart shows the product’s Amazon Best Seller Rank over time. BSR is a relative ranking of how well a product sells within its category — the lower the number the better the product is selling. Every time a product is purchased its BSR drops. When nothing is selling the BSR rises back up. The green line therefore traces the sales activity of the product over the full chart period.
| Green Line Pattern | What It Means | Wholesale Signal |
|---|---|---|
| Regular frequent drops — consistent across all 12 months | Strong year-round demand — product sells daily or near-daily | ✅ Excellent |
| Drops concentrated in specific months — flat otherwise | Seasonal product — demand peaks in those months only | ⚠️ Seasonal |
| Mostly flat line with occasional small dips | Very slow selling product — sells rarely | ❌ Avoid |
| Drops getting less frequent month on month | Declining product — losing market demand over time | ❌ Avoid |
| Drops getting more frequent month on month | Growing product — demand increasing over time | ✅ Very good |
💡 How to Set the Right Time Period on Keepa
Always set your Keepa chart to show at least 12 months of data before drawing any conclusions. A product that looks consistent over 3 months may show a very different pattern over 12 months — revealing seasonality that was not visible in the shorter view or a declining trend that only appears clearly when the full year is shown. Never make a sourcing decision based on a Keepa chart set to less than 12 months.
Line 2 — The Orange Line — Amazon as a Seller
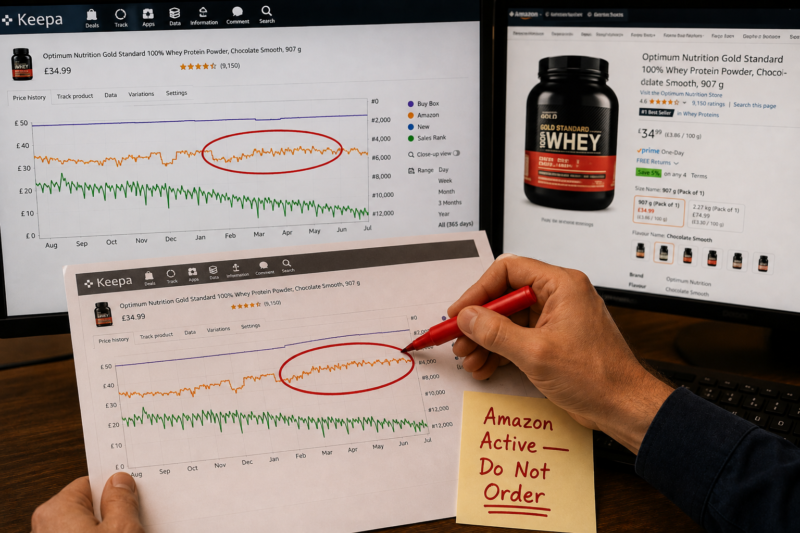
The orange line is the most important line on the Keepa graph for wholesale FBA sellers. It shows when Amazon itself — as a first-party seller — has been active on the listing. When Amazon holds the Buy Box third-party sellers receive almost no sales regardless of their price or seller metrics. An orange line appearing on your Keepa chart is a critical warning sign.
| Orange Line Scenario | What It Means | Action |
|---|---|---|
| No orange line visible at all | Amazon has never sold this product — ideal for third-party sellers | ✅ Green light |
| Orange line appeared briefly once — then gone | Amazon tested selling briefly but exited — possible opportunity | ⚠️ Proceed cautiously |
| Orange line appears regularly — comes and goes | Amazon dips in and out — unpredictable competition risk | ❌ Avoid |
| Orange line consistently present across the whole chart | Amazon dominates this listing — third-party sellers get almost nothing | ❌ Never source |
Line 3 — The Blue Line — Buy Box Price
The blue line tracks the Buy Box price over time — the price that appears on the product page that customers click to purchase. This is the most commercially significant price on any Amazon listing because it is the price at which the vast majority of sales occur. For wholesale FBA sellers the blue line tells you whether the market price for this product is healthy stable and protective of your margins — or declining in a way that will erode your profitability every month.
| Blue Line Pattern | What It Means for Your Margin | Signal |
|---|---|---|
| Flat or gently rising over 12 months | Healthy market — MAP enforced — margins protected | ✅ Strong |
| Slight dips but quickly recovers | Minor price competition — market corrects itself — acceptable | ✅ Acceptable |
| Steady downward trend over 12 months | Price erosion — margin compression — race to bottom underway | ❌ Avoid |
| Dramatic drops then partial recovery | Price wars between sellers — unpredictable margin risk | ❌ High risk |
Line 4 — The Red Line — New Third-Party Seller Price
The red line tracks the lowest new price offered by third-party sellers on the listing — not the Buy Box price but the absolute cheapest available new price at any given time. The relationship between the red line and the blue line tells you a great deal about the competitive dynamics on the listing. When the red and blue lines closely track each other it means competition is tight and most sellers are pricing near the Buy Box price. When the red line sits significantly below the blue line it indicates a seller undercutting the market — which can trigger a price war that compresses margins for all sellers.
Line 5 — The Black Line — Number of Sellers
Some Keepa views include a black or dark line showing the total number of sellers on the listing over time. This line tells you whether the listing has been getting more or less competitive over the period you are reviewing. A rising seller count combined with a falling blue line price is the clearest possible signal of a listing in a race-to-the-bottom price war that you should avoid entirely.
How to Read a Keepa Graph — The Complete Step-by-Step Process
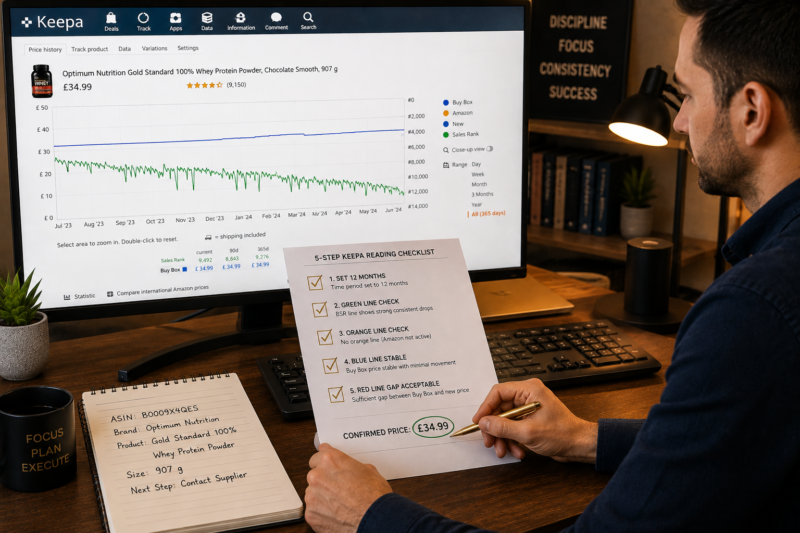
Here is the exact sequence to follow every time you open a Keepa chart for a product you are researching. Work through every step in order — never skip ahead — and make your sourcing decision only after completing all checks:
Set the Time Period to 12 Months Minimum
Click the time range selector on the Keepa chart and set it to show at least 12 months of data. If the product has been on Amazon for two years set the range to 24 months — the longer the history the more confident you can be in any pattern you identify. Never make a decision from a 30-day or 90-day view — these are too short to identify seasonal patterns or gradual trends.
Examine the Green Line — Sales Rank Pattern
Look at the green BSR line first. Count roughly how many drops occur per month on average. A product selling 30 units per month in a category ranked around 50,000 might show drops every 1 to 2 days. A product selling 5 units per month might show drops every 6 to 7 days. The frequency and consistency of the drops tells you both velocity and reliability of demand.
Check for the Orange Line — Amazon Presence
Scan the entire 12-month chart for any orange line activity. This is your most important check. If you see consistent orange line presence at any point in the chart period note when it appeared and whether it has since cleared. Even a brief period of Amazon selling in the past is a warning that Amazon may return — treat any orange line history with caution and only proceed if Amazon has been clearly absent for at least 6 consecutive months.
Analyse the Blue Line — Price Stability
Look at where the blue Buy Box price line started 12 months ago and where it is today. Calculate the approximate percentage change. A product that was selling for £15 twelve months ago and is now selling for £13 has experienced approximately 13 percent price erosion — which could reduce your margin from 35 percent to 20 percent depending on your cost structure. That is a product entering a price war — not one you want to stock.
Check the Red Line Versus Blue Line Gap
Compare the red new seller price line to the blue Buy Box price line. If they track closely together — within £0.50 — competition is normal and healthy. If the red line sits significantly below the blue line — more than £1 to £2 — there is a seller aggressively undercutting the market. This underpricing often triggers repricing wars that pull the entire Buy Box price down over the following weeks.
Keepa Graph Patterns — What a Good Product Looks Like vs a Bad One
| ✅ Strong Wholesale Product — Keepa Signals | ❌ Weak or Risky Product — Keepa Signals |
|---|---|
| Green line drops consistently every 1 to 3 days | Green line mostly flat — drops only once per week or less |
| No orange line anywhere on the 12-month chart | Orange line visible at any point in the chart history |
| Blue line flat or rising — price held over 12 months | Blue line declining month on month — price erosion underway |
| Red line tracks closely to blue line — no aggressive undercutting | Red line sits significantly below blue — price war in progress |
| Consistent pattern across all 12 months — no dramatic changes | Erratic pattern — sudden changes in rank or price that are unexplained |
| BSR comfortably under 50,000 in main category | BSR above 100,000 — product barely selling in category |
Common Keepa Reading Mistakes New Sellers Make
| Common Mistake | Why It Causes Problems | Correct Approach |
|---|---|---|
| Using a 30-day chart view only | Misses seasonality declining trends and historical Amazon presence | Always use 12 months minimum — 24 months where available |
| Ignoring a brief orange line period | Amazon may return — stock gets stranded with no Buy Box share | Treat any orange line history as a risk flag regardless of when it appeared |
| Assuming one spike means consistent demand | Single spike may be a one-off promotion or viral moment — not repeatable demand | Require multiple consistent drops throughout the full 12-month period |
| Accepting slow decline as acceptable | A slow price decline today becomes a margin-destroying trend in 3 to 6 months | Any consistent downward price trend is a disqualifying factor |
| Not checking subcategory BSR | Main category BSR of 50,000 may mean very different velocity in different categories | Always check subcategory rank for more precise demand context |
Keepa Pricing — What Does It Cost?
Keepa costs approximately €19 per month for full data access — making it one of the most cost-effective tools in any Amazon FBA seller’s research stack. The free version of Keepa shows basic price history but limits access to sales rank data which is essential for wholesale sourcing decisions. A Keepa subscription pays for itself many times over with a single correctly researched product order — and prevents losses many times its cost by correctly identifying products that should not be ordered.
| Keepa Plan | Cost | What You Get |
|---|---|---|
| Free | £0 | Basic price history — no sales rank data — not sufficient for wholesale research |
| Subscriber | ~€19/month | Full price and BSR history — all chart lines — data exports — essential for wholesale |
Conclusion — Keepa is Non-Negotiable for Wholesale FBA Research
Reading a Keepa graph correctly is the single most important research skill for Amazon FBA wholesale sellers. Every product you order should be backed by a clean Keepa chart — consistent green drops no orange line and a stable blue price. Every product that fails any of these checks should be removed from your sourcing shortlist immediately regardless of how good the wholesale price looks.
Subscribe to Keepa and use it on every product before every sourcing decision. Find the wholesale brands behind your validated products in our Brands Directory. And calculate your exact margins using AMZScout before placing any wholesale order.
START READING KEEPA GRAPHS TODAY
Find Products That Pass Every Keepa Check
Once you have identified a product with a clean Keepa chart find its verified wholesale supplier in the Brandhunterz Brands Directory and place your first data-backed wholesale order with confidence.
About the Author
This article is written by the team at Brandhunterz Ltd — a UK registered Amazon FBA wholesale sourcing company (Company No: 15342697) registered in England and Wales since 2023. Visit brandhunterz.com to learn more.