
FBA PACKAGING AND SHIPPING
How to Manage FBA Inventory Levels and Avoid Stockouts and Overstock
By Brandhunterz Ltd | Company No: 15342697 | 14 minute read
Affiliate Disclosure: This article contains affiliate links. If you purchase through our links we may earn a commission at no extra cost to you. We only recommend tools we genuinely use and believe in. Read our full disclaimer.
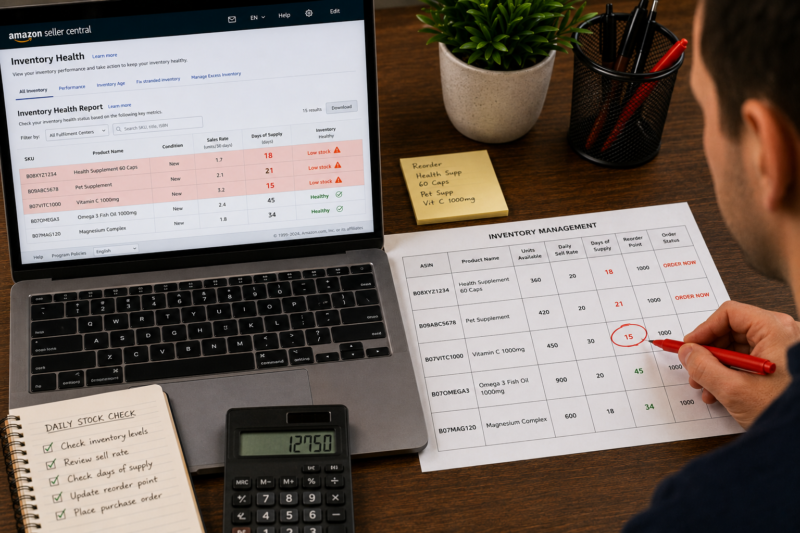
Managing FBA inventory levels is one of the most important and most underestimated operational skills in Amazon FBA wholesale. Running out of stock — a stockout — means your listing goes inactive your sales velocity resets and you lose ranking position that can take weeks to recover. Holding too much stock — overstock — means your capital is tied up in the warehouse your aged inventory fees accumulate and you face the cost of either discounting to clear or paying for long-term storage. Both problems hurt your business directly and both are predictable and preventable when you manage your replenishment cycle with the right metrics and the right rhythm.
We are Brandhunterz Ltd — a UK registered wholesale sourcing company (Company No: 15342697) — and in this complete guide we cover every aspect of FBA inventory management that wholesale sellers need to know — from understanding your sell-through rate and days of stock remaining through calculating your reorder point setting your safety stock buffer managing seasonal demand and using Seller Central’s inventory tools to track and act on your stock levels before a problem develops.
💡 Quick Summary
The two core metrics for FBA inventory management are your daily sell rate — how many units you sell per day on average — and your days of stock remaining — how many days of sales your current FBA inventory covers. Your reorder point is the number of days of stock remaining at which you must place your next wholesale order to ensure new stock arrives before you run out — calculated by adding your supplier lead time to your inbound transit time and adding a safety stock buffer of 7 to 14 days. Check these metrics weekly for every active ASIN and replenish before you hit your reorder point.
Why Stockouts and Overstock Are Both Costly for Wholesale Sellers
Before covering the management process it is worth understanding the exact cost of each problem — because both are significant and both motivate the discipline required to manage inventory consistently:
| Problem | Direct Cost | Hidden Cost |
|---|---|---|
| Stockout | Lost sales — zero revenue while out of stock — potentially days or weeks of zero income from that ASIN | Listing suppression — sales velocity reset — BSR drop — ranking loss that takes time and sales to recover |
| Overstock | Monthly FBA storage fees accumulating on excess units — long-term storage fees after 365 days | Capital tied up in warehouse rather than deployed into new profitable products — cash flow constraint |
The Two Core Metrics — Daily Sell Rate and Days of Stock Remaining
Every inventory management decision you make should be driven by two numbers — your daily sell rate and your days of stock remaining. These two metrics tell you exactly how fast your inventory is moving and how long it will last at the current rate of sale. Everything else — reorder points safety stock buffers and seasonal adjustments — is built on top of these two foundations.
Metric 1 — Daily Sell Rate
Your daily sell rate is the average number of units of a specific ASIN you sell per day. Calculate it using your actual sales data from Seller Central over a recent representative period — typically the last 30 days for stable products and the last 7 to 14 days if demand has recently changed significantly.
DAILY SELL RATE FORMULA
Units Sold in Period ÷ Number of Days in Period
Example: 180 units sold in 30 days = 6 units per day daily sell rate
Metric 2 — Days of Stock Remaining
Your days of stock remaining tells you how long your current FBA inventory will last before you run out at your current daily sell rate. This figure changes every day as units sell — which is why reviewing it on a fixed weekly schedule rather than sporadically is critical to avoiding surprise stockouts.
DAYS OF STOCK REMAINING FORMULA
Current FBA Units Available ÷ Daily Sell Rate
Example: 90 units available ÷ 6 units per day = 15 days of stock remaining
Calculating Your Reorder Point
Your reorder point is the number of days of stock remaining at which you must place your next order to ensure new inventory arrives at Amazon before you run out. It is not a fixed number that applies to every product — it changes based on your supplier’s lead time and your inbound transit time to FBA. Here is how to calculate it for any product:
REORDER POINT CALCULATION
| Component | Days | Example |
| Supplier lead time — order placed to stock dispatched | Variable | 7 days |
| Inbound transit time — dispatch to FBA arrival | Variable | 3 days |
| FBA receiving time — arrival to inventory live | 1 to 5 days | 3 days |
| Safety stock buffer — protection against delays | 7 to 14 days | 10 days |
| Reorder Point — Days of Stock Remaining to Trigger Order | 23 days | |
When your days of stock remaining drops to 23 days — place your next wholesale order immediately
Setting Your Safety Stock Buffer
Your safety stock buffer is the cushion of extra inventory time you build into your reorder point to absorb unexpected delays — a supplier who dispatches a day late a courier who takes longer than usual a bank holiday that adds a day to the FBA receiving queue. For most wholesale FBA sellers selling standard products with reliable UK suppliers a 7 to 14 day safety stock buffer is appropriate. Adjust this based on your experience of how reliably your specific supply chain operates:
| Supply Chain Reliability | Recommended Safety Stock Buffer |
|---|---|
| Highly reliable UK supplier — consistent lead times — never delays | 7 days |
| Standard UK supplier — occasional 1 to 2 day delays | 10 to 14 days |
| New supplier — reliability not yet established | 14 to 21 days |
| High-demand seasonal period — peak sales velocity | 21 days minimum |
Calculating Your Replenishment Order Quantity
When your days of stock remaining triggers your reorder point you need to place an order for the right quantity — not too many units that create overstock and not too few that cause another stockout before the next order arrives. Here is the formula for calculating your optimal replenishment order quantity:
REPLENISHMENT ORDER QUANTITY FORMULA
Daily Sell Rate × Target Days of Cover
Minus units already in transit to FBA or awaiting shipment
Example: 6 units per day × 60 days target cover = 360 units to order (minus any already in transit)
Your target days of cover — how many days of sales each order should cover — depends on your minimum order quantity from the supplier your available capital and your storage cost tolerance. For most wholesale sellers 45 to 90 days of cover per order is a practical range that balances stock security against capital efficiency.
Using Seller Central to Monitor FBA Inventory Levels
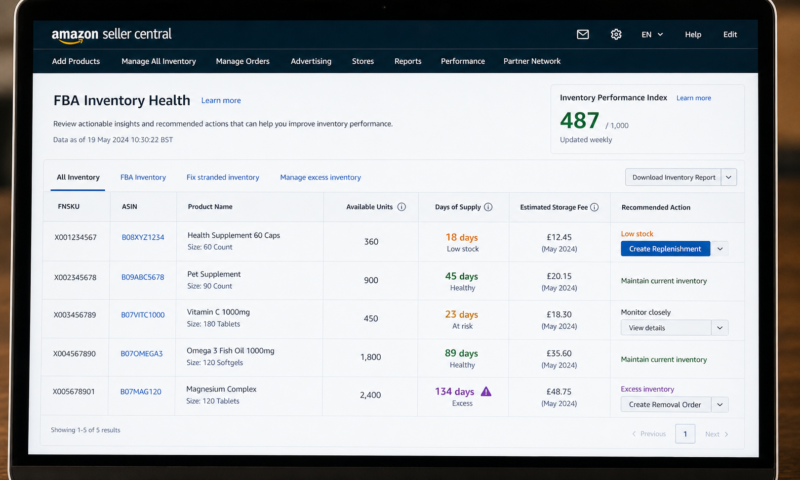
Amazon Seller Central provides several tools for monitoring your FBA inventory levels and identifying stock health issues before they become urgent problems. Here is where to find the most useful inventory data and how to use it:
| Seller Central Tool | Where to Find It | What It Shows |
|---|---|---|
| FBA Inventory page | Inventory → Manage FBA Inventory | Units available — units in inbound shipment — units reserved — units stranded |
| Inventory Health Report | Inventory → FBA Inventory — Inventory Health | Days of supply — estimated storage fees — sell-through rate — recommended action |
| Restock Report | Inventory → Restock Inventory | Amazon’s suggested reorder quantities and timing based on your sales velocity |
| Sales and Traffic Report | Reports → Business Reports → Sales and Traffic | Units ordered by ASIN by date — used to calculate your actual daily sell rate |
| Stranded Inventory Alert | Inventory → Fix Stranded Inventory | Units in FBA that cannot be sold due to listing issues — must be resolved to make inventory available |
Managing Seasonal Demand — Adjusting for Peak Periods
Most wholesale FBA products experience some degree of seasonal variation in demand. Health and Beauty products often see uplift during gift-giving periods. Pet supplies see higher demand in winter months. Household products spike around spring cleaning periods. Failing to account for seasonal demand increase when calculating your reorder point and order quantity is one of the most common causes of stockouts for otherwise well-managed FBA businesses.
| Seasonal Demand Management Action | When to Apply |
|---|---|
| Use a 14-day rather than 30-day sell rate window | When you are entering a peak demand period — recent sales more accurately reflect current velocity |
| Apply a demand multiplier to your sell rate | When historical data shows a consistent seasonal uplift — multiply your base sell rate by the expected uplift factor |
| Increase safety stock buffer to 21 days for peak periods | 4 to 6 weeks before any known peak — suppliers also experience increased demand and may have longer lead times |
| Place peak stock order earlier than your normal reorder point | 6 to 8 weeks before a known peak period — accounts for supplier lead time delays during busy periods |
| Review sell rate weekly rather than monthly during peak periods | During the peak period itself — demand can accelerate rapidly and weekly review catches a velocity spike early |
Managing Overstock — When You Have Too Much in FBA
Overstock occurs when your FBA inventory covers significantly more days of sales than your target — typically when you have ordered too much ordered at the wrong time or when your daily sell rate has dropped below forecast. If your days of supply exceeds 120 days you are likely paying more in storage fees than the holding cost is worth for that stock. Here are the options for addressing overstock:
| Overstock Resolution Option | How It Works | Best For |
|---|---|---|
| Run a price reduction or promotion | Lower your price temporarily to accelerate sell-through — sacrifice some margin to clear stock faster | Moderate overstock — when storage fees are lower than the margin sacrifice of discounting |
| Create a removal order | Request Amazon returns your units to your address — pay a per-unit removal fee | Stock approaching long-term storage fee threshold — when removal cost is lower than accumulated storage |
| Sell through alternative channels | Remove stock and list on eBay — local marketplaces — or sell to a clearance buyer | Products with limited Amazon demand but viable value elsewhere |
| Pause replenishment orders | Do not reorder until existing stock reaches your normal reorder point | Moderate overstock where days of supply is high but not urgently so — allow stock to sell down naturally |
Your Weekly FBA Inventory Review Process
Inventory management only works when it is done consistently. A single weekly review of all your active FBA ASINs — using the metrics and thresholds in this guide — takes under 30 minutes for most sellers and eliminates the vast majority of both stockout and overstock situations before they develop into real problems. Here is the weekly review process to follow:
Pull the Inventory Health Report From Seller Central
Every Monday open Seller Central and go to Inventory — FBA Inventory — Inventory Health. Download the current report as a spreadsheet. This gives you the days of supply figure for every active ASIN — which is your starting point for the review. Sort the report by days of supply from lowest to highest so that the most urgent ASINs appear at the top.
Flag Any ASIN at or Below Your Reorder Point
Identify every ASIN whose days of supply figure is at or below your calculated reorder point. These ASINs need a replenishment order placed this week — not next week and not when you remember. Place orders for flagged ASINs before you close the spreadsheet. If you are sourcing from a supplier with a catalogue you already buy from regularly this can be done in a single email or phone call covering multiple ASINs.
Flag Any ASIN With Over 120 Days of Supply
Identify every ASIN with more than 120 days of supply. These are overstock situations requiring action — either a price reduction to accelerate sell-through a removal order or a decision to pause replenishment. Calculate the monthly storage fee cost for each overstock ASIN and compare it against the cost of the available resolution options to decide which action is most cost-effective.
Update Your Inventory Tracker Spreadsheet
Record the current days of supply figure for every ASIN in your own inventory tracker alongside the orders you have placed and the expected inbound arrival dates. This creates a running picture of your inventory position across your entire catalogue that is far easier to act on than returning to Seller Central cold each week without a baseline to compare against.
Using Keepa to Monitor Sales Velocity and Demand Trends
Keepa is invaluable for inventory management beyond your own Seller Central data. The BSR history graph on Keepa shows you the ranking trend for any ASIN over time — a consistently improving or stable BSR confirms your daily sell rate assumption is sound while a deteriorating BSR signals that demand is slowing and your next order quantity should be reduced. Keepa’s Seller Count graph also shows you how many sellers are competing on the listing — if seller count is increasing your share of the buy box may be falling and your effective daily sell rate may be lower than your total units sold figure suggests.
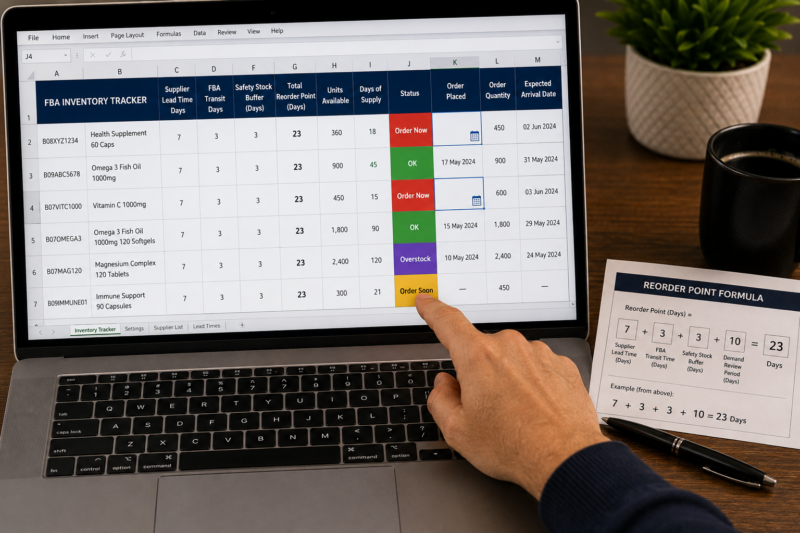
The FBA Inventory Management Reference Sheet
| Days of Supply Status | Colour Code | Action Required |
|---|---|---|
| Below reorder point — order immediately | 🔴 Red | Place wholesale order this week — no delay |
| Within 7 days of reorder point — monitor closely | 🟡 Amber | Prepare to place order — confirm supplier availability |
| Above reorder point — healthy stock level | 🟢 Green | No action required — review again next week |
| Over 120 days supply — overstock risk | 🟣 Purple | Review options — price reduction removal or pause reorder |
Conclusion — Consistent Weekly Reviews Prevent Both Stockouts and Overstock
FBA inventory management is not a complex discipline but it demands consistency. A 30-minute weekly review using your days of supply data your reorder point calculations and your supplier lead times is all it takes to keep every active ASIN within a healthy stock range indefinitely. Sellers who do this every week without exception rarely experience stockouts. Sellers who manage inventory reactively — checking only when something feels wrong — face stockouts and overstock regularly and pay the cost in lost sales frozen capital and storage fees.
Find your next wholesale brand through our Brands Directory. Research every product’s sales trend with Keepa. Confirm your margin with AMZScout. And manage every FBA inventory position with the weekly review process in this guide.
FIND YOUR NEXT WHOLESALE BRAND TO ADD TO YOUR FBA CATALOGUE
Browse 5,000+ Verified Wholesale Brands Free
Find verified wholesale trade contacts in the Brandhunterz Brands Directory — source your next product apply for your account and manage your FBA inventory using the system in this guide.
About the Author
This article is written by the team at Brandhunterz Ltd — a UK registered Amazon FBA wholesale sourcing company (Company No: 15342697) registered in England and Wales since 2023. Visit brandhunterz.com to learn more.