
HOW TO START AMAZON FBA · 2026
How to Read a Keepa Graph for Amazon FBA Wholesale Research
By Brandhunterz Ltd | Company No: 15342697 | 13 minute read
Affiliate Disclosure: This article contains affiliate links. If you purchase through our links we may earn a commission at no extra cost to you. We only recommend tools we genuinely use and believe in. Read our full disclaimer.
If you are serious about building a profitable Amazon FBA wholesale business Keepa is the single most important research tool you will use every day. It shows you the complete price and sales history of every product on Amazon — giving you the data to make evidence-based sourcing decisions instead of guesses. But for new sellers the Keepa graph can look overwhelming at first glance. Multiple coloured lines dozens of data points and a timeline stretching back years can make the graph feel impossible to interpret.
We are Brandhunterz Ltd — a UK registered wholesale sourcing company (Company No: 15342697) — and in this complete guide we break down exactly how to read a Keepa graph for Amazon FBA wholesale research in 2026. By the end of this article you will understand every line on the graph know what to look for and feel completely confident using Keepa to validate every wholesale product before placing an order.
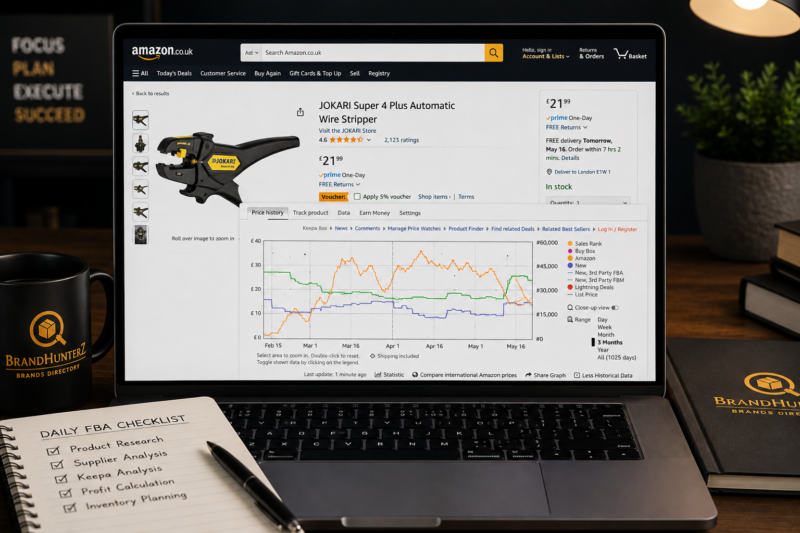
💡 Quick Summary
The three most important lines on a Keepa graph for wholesale research are the Sales Rank (orange line showing purchase events), the Buy Box Price (green line showing what the winning seller charges), and the New Seller Count (blue line showing competition levels). A good wholesale product shows consistent rank drops over 12 months, a stable or rising Buy Box price, and between 3 and 15 active sellers. Subscribe to Keepa to access all historical data — the free version only shows 3 months of history which is insufficient for wholesale validation.
What is Keepa and Why Do Wholesale Sellers Need It?
Keepa is a price tracking and product research tool that records the complete pricing and sales history of every product listed on Amazon. It tracks data across all major Amazon marketplaces including UK, USA, Germany, France, Italy, Spain, Canada, Japan, and Australia — updated multiple times every hour. When you install the Keepa Chrome extension and visit any Amazon product page you immediately see the historical graph embedded directly below the product images.
For Amazon FBA wholesale sellers Keepa solves a fundamental research problem — you cannot safely invest in wholesale stock based on how a product looks today. Today’s Best Sellers rank and price could be a temporary spike or an unusual promotional event that will not repeat. Keepa shows you the full history — 12 months 24 months or longer — giving you the evidence to confirm whether a product has genuine consistent demand before committing your capital.
The Keepa Graph — Every Line Explained
The Keepa graph uses multiple coloured lines to display different types of data simultaneously. Here is a complete reference guide to every line you will encounter:
| Line Colour | What It Tracks | Importance for Wholesale |
|---|---|---|
| Orange Line | Sales Rank — shows product position in its Amazon category over time | CRITICAL — primary demand indicator |
| Green Line | Buy Box Price — the price charged by the current Buy Box winner | CRITICAL — your likely selling price |
| Blue Line | New Seller Count — number of third-party sellers offering the product | CRITICAL — competition level indicator |
| Dark Orange Line | Amazon Price — price when Amazon itself sells the product as first-party seller | RED FLAG — avoid if Amazon holds Buy Box |
| Purple Line | New Price — lowest new condition price from all third-party sellers | Useful — shows lowest competition price |
| Teal Line | Used Price — lowest used condition price from third-party sellers | Less relevant for wholesale new stock |
| Grey Line | List Price — manufacturer’s recommended retail price (RRP) | Useful for calculating wholesale discount |
The Orange Line — Reading Sales Rank History
The orange sales rank line is the most important element of the Keepa graph for wholesale product research. Understanding it correctly is the difference between sourcing a genuinely strong product and getting stuck with slow-moving stock that generates storage fees instead of profit.
How Sales Rank Works on the Graph
Sales rank on Amazon is a relative position within a category — the lower the number the more frequently the product is selling. On the Keepa graph the orange line moves DOWN when a product is ranked better (selling more) and UP when ranked worse (selling less). Every DROP in the orange line represents one or more purchase events. The frequency of drops shows how often the product sells.
For wholesale research you want to see the orange line dropping frequently and consistently across all 12 months of history — not just during specific periods. Here is how to interpret different patterns:
Consistent Drops Every 2 to 5 Days — Strong Product
When the orange line shows regular consistent drops every 2 to 5 days across all 12 months of data this confirms the product is selling multiple units per week continuously. This is the pattern you are looking for in wholesale products — genuine steady repeat purchase demand that gives you predictable revenue and manageable stock rotation.
Seasonal Spikes With Flat Periods — Seasonal Product
When the orange line shows strong drops during specific months followed by long flat or rising periods the product has seasonal demand. Christmas decorations sell strongly in Q4 and barely at all in Q1 to Q3. Garden products spike in spring and summer. For your first wholesale product avoid seasonal patterns — focus on consistent 12-month demand that generates revenue every week of the year.
Single Spike Then Flat — Viral or Trend Product
When the orange line shows one or two large drops followed by a long flat period at a very high rank number the product had a brief viral moment but no sustained demand. Sourcing this product today means arriving after the peak demand has passed. Remove it from your shortlist and replace it with a product showing consistent long-term demand.
No Drops or Very Rare Drops — Poor Demand
When the orange line barely moves over months or shows only occasional isolated drops the product is selling very rarely — potentially fewer than one unit per week. This is a poor wholesale product regardless of how attractive the margin looks. A product with 35 percent margin that sells one unit per month generates less profit than a 22 percent margin product selling 20 units per week.
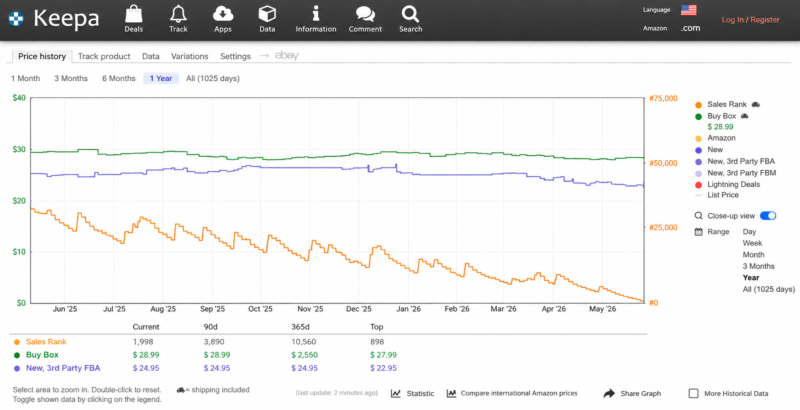
The Green Line — Reading Buy Box Price History
The green Buy Box price line shows the price that the winning seller has been charging over the selected time period. This is the price you will realistically be selling at when you win Buy Box rotation — making it the most important pricing reference for your margin calculations. Never calculate your margin using today’s price alone — always check the full 12-month Buy Box price history on Keepa.
What to Look For in the Green Line
Stable or Slowly Rising Price — Healthy Market
A green line that stays within a consistent range over 12 months — or slowly trends upward — indicates a healthy seller environment where no one is aggressively undercutting. This is the ideal scenario for wholesale sellers because it means your margin calculation based on the current price is likely to remain accurate over the period you hold the stock.
Consistently Declining Price — Race to the Bottom
A green line that shows a consistent downward trend over 6 to 12 months indicates a race-to-the-bottom pricing environment. Today’s margin calculation will overstate the margin you will actually achieve because by the time you sell your stock the price will likely be lower. Avoid products with declining price trends for your wholesale sourcing.
Extreme Price Spikes — Out of Stock Periods
When the green line shows dramatic spikes to unusually high prices followed by sudden drops back to normal levels this typically indicates out-of-stock periods where remaining sellers raised prices to take advantage of reduced competition. These spikes are a positive signal for wholesale sellers — they confirm the product has strong demand that outstrips supply and that your FBA stock will sell quickly when competitors run out.
The Blue Line — Reading Seller Count History
The blue seller count line shows how many third-party sellers have been offering the product over time. This is your competition indicator — it tells you how many other sellers you will be sharing the Buy Box with when you list. Understanding the seller count pattern helps you assess how much of the available sales you can realistically expect to capture.
| Seller Count Range | What It Means | Action |
|---|---|---|
| 0 to 2 sellers | Possibly brand restricted or very niche product | Investigate restriction before sourcing |
| 3 to 10 sellers | Healthy competition — enough demand to support multiple sellers | Ideal sweet spot — source this product |
| 11 to 20 sellers | Higher competition — Buy Box time more fragmented | Proceed with caution — check price stability |
| 20 plus sellers | Highly saturated — extremely competitive Buy Box environment | Avoid — not suitable for wholesale sourcing |
| Amazon as seller | Amazon holds Buy Box as first-party seller | Do not source — Amazon always wins Buy Box |
How to Set Up Keepa for Wholesale Research
Getting the most out of Keepa for wholesale research requires a few specific settings and habits that help you read the data correctly and efficiently.
Always Set the Time Range to 12 Months
The default Keepa graph often shows 3 months of data. For wholesale research always extend this to 12 months using the time range selector at the top of the graph. Three months of data is insufficient to identify seasonal patterns or to confirm that a product has genuinely consistent demand rather than a temporary boost from a promotion or sponsored ad campaign.
Enable Only the Lines You Need
The Keepa graph can become cluttered when all lines are displayed simultaneously. For wholesale research focus on three lines — Sales Rank (orange), Buy Box Price (green), and New Seller Count (blue). Toggle off the used price Amazon price and list price lines to create a cleaner graph that is easier to read quickly when evaluating multiple products in a research session.
Use the Keepa Product Finder for Bulk Research
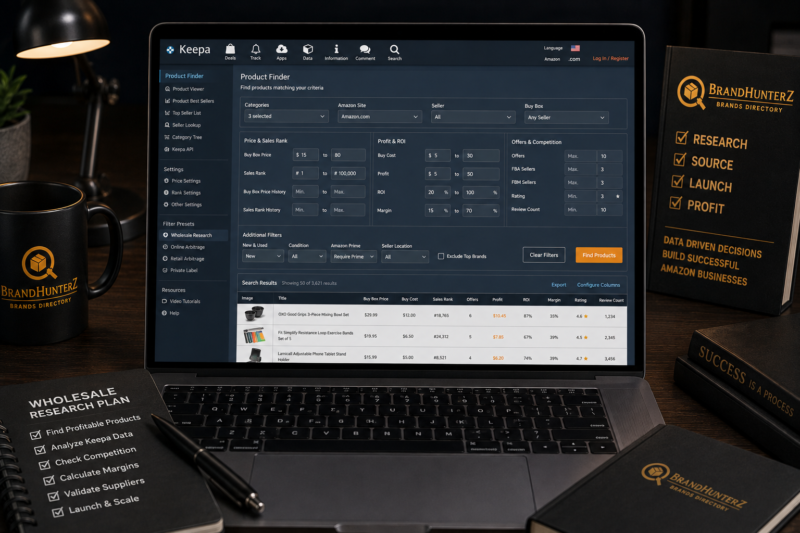
Beyond the individual product graph Keepa’s Product Finder allows you to filter Amazon’s entire catalogue by sales rank range, category, price range, number of sellers, and review count. Use this tool to generate a shortlist of products meeting your wholesale criteria in bulk — then validate each one individually on the full graph before adding it to your sourcing list.
Subscribe to the Paid Plan for Full Historical Access
The free version of Keepa only shows 3 months of historical data which is completely insufficient for wholesale product research. The paid subscription at approximately £16 per month gives you unlimited historical data going back years and access to the Product Finder and other advanced research tools. This subscription is the single best return-on-investment tool purchase you can make as a new wholesale seller.
The Complete Keepa Checklist for Wholesale Products
Apply this five-point Keepa checklist to every product before adding it to your wholesale sourcing list. A product must pass all five checks to qualify for sourcing consideration. If it fails even one check remove it from your list and replace it with a stronger opportunity.
✅ The Keepa Five-Point Wholesale Checklist
- ✓ Orange Line: Consistent rank drops every 2 to 7 days across all 12 months
- ✓ Orange Line: Sales rank consistently under 50,000 in its main category
- ✓ Green Line: Stable or rising Buy Box price over 12 months — no consistent decline
- ✓ Blue Line: Between 3 and 15 active third-party sellers consistently
- ✓ Dark Orange: Amazon NOT holding the Buy Box as a first-party seller
Frequently Asked Questions
Is the Free Version of Keepa Enough for Wholesale Research?
No — the free version of Keepa only provides 3 months of historical data which is completely insufficient for wholesale product validation. You cannot identify seasonal patterns or confirm genuine long-term demand with only 3 months of data. The paid subscription at approximately £16 per month is essential for serious wholesale research and pays for itself with the first good product decision it helps you make — or the first bad product decision it helps you avoid.
What Sales Rank Should I Target for Wholesale Products?
A sales rank consistently under 50,000 in its main category is a good starting benchmark for wholesale products. However the interpretation of sales rank varies significantly by category. A rank of 2,000 in Books represents a different sales velocity than a rank of 2,000 in Health and Beauty. Always focus on the frequency of rank drops on the Keepa graph rather than the absolute rank number as your primary demand signal.
How Do I Know if Amazon is Selling a Product on the Keepa Graph?
Amazon’s first-party sales show as a dark orange line on the Keepa graph — separate from the Buy Box price green line. When the dark orange line is present and active it indicates Amazon is selling the product as a vendor (first-party seller). You can also scroll down below the Keepa graph to see the current seller offers table which will show Amazon in the seller list if they are currently active on the listing.
Can I Use Keepa to Research Products on Amazon USA?
Yes — Keepa tracks data across all major Amazon marketplaces including UK, USA, Germany, France, Italy, Spain, Canada, Japan, and Australia. Simply change the marketplace selector in the Keepa extension or dashboard to the specific Amazon marketplace you want to research. This makes Keepa invaluable for sellers who source products for multiple Amazon marketplaces simultaneously — including UK and USA wholesale sellers using the Brandhunterz directory.
Related Articles — Keep Learning
- How to Start Amazon FBA in 2026 — Complete Beginner Guide
- How to Find Your First Wholesale Product to Sell on Amazon FBA
- How to Calculate Amazon FBA Fees and Profit Margins
- Amazon FBA vs FBM — Which Model is Right for You in 2026
- How to Get Ungated on Amazon — A Beginner’s Guide
- Amazon FBA Seller Central — A Complete Beginner’s Walkthrough
- How to Scale Your Amazon FBA Business from £0 to £10,000 Monthly
- Browse the Brandhunterz Brands Directory — Free Access
START YOUR KEEPA RESEARCH TODAY
Browse Verified Wholesale Brands — Free Access
Now you know how to read Keepa like a professional wholesale seller use the Brandhunterz Brands Directory to find the brands worth researching. Free access to verified wholesale brands with real trade contacts confirmed minimum orders and Amazon FBA approval status.
About the Author
This article is written by the team at Brandhunterz Ltd — a UK registered Amazon FBA wholesale sourcing company (Company No: 15342697) registered in England and Wales since 2023. Visit brandhunterz.com to learn more.